Ben Smithgall
Welcome to the web blog


Bit pusher at Spotify. Previously Interactive News at the New York Times, U.S. Digital Service, and Code for America.
OpenVisConf and Citibike Trips
April 27, 2014
Open Vis
I just got back from the exceptionally well done Open Vis conference which featured a number of truly excellent talks and speakers. If you are interested in data visualization, design, color theory, or a host of other topics, I highly recommend that you watch the website for when the conference videos are posted.
Visualizing Citibike Trips
Inspired by Open Vis, I thought I’d take a look at the recently posted trip-level data dumps from Citibike, available here. I decided to take a look at the most recently available month of data. I was mostly curious about the relationships between different stations and seeing how people used the network. Because the data that actually powers the visual is pretty big, I’ve put it on a [separate page]((https://bensmithgall.com/projects/citibike-trips.html), and have pasted screenshotsin this post instead.
Top Origins and their destinations
In order, the top five stations for trip origins are:
- Lafayette St & E 8 St (2,920 trips)
- E 42 St & Vanderbilt Ave (2,719 trips)
- E 17 St & Broadway (2,493 trips)
- W 21 St & 6 Ave (2,403 trips)
- 8 Ave & W 31 St (2,171 trips)
Let’s take a closer look at top origin station.
Lafayette St & E 8 St
It’s a bit unsurprising that this station is such a common origin station – it’s geographically very central to the station network:
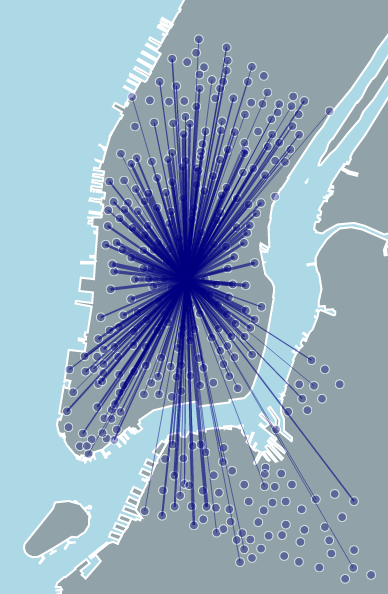
This station has destinations of almost every other station in the system (save a chunk of Brooklyn that is not near a bridge).
Lafayette’s top five destinations are:
- E 6 St & Avenue B (115 trips)
- E 7 St & Avenue A (97 trips)
- E 10 St & Avenue A (96 trips)
- E 9 St & Avenue C (75 trips)
- St Marks Pl & 1 Ave (71 trips)
This pattern is interesting as well, because it looks as though all of the top destinations for this station are clustered geographically.
Top Destinations
Also interesting are the top destination stations. The top five destinations on Citibike are:
- Lafayette St & E 8 S (2622 trips ended here)
- W 21 St & 6 Ave (2453 trips ended here)
- Pershing Square N (2419 trips ended here)
- E 17 St & Broadway (2320 trips ended here)
- 8 Ave & W 31 St (2205 trips ended here)
This is very interesting, because it shows that the same stations are both common as destinations and as starting points. This information might be valuable in tinkering with the Citibike rebalancing project.
Exploring Citibike’s Network
While these top-level stats are interesting, I also wanted to be able to explore the citibike network and see relatonships between the different stations. I put together this visualization of the February Citibike trips to try to explore the data. The code is available as a gist and on bl.ocks.
The Citibike trips data set is fairly comprehensive and interesting. There have already been some really great work done with it, like this awesome visualization of rides over a 48-hour period. You can get the data from the Citibike website, and I encourage you to check it out!